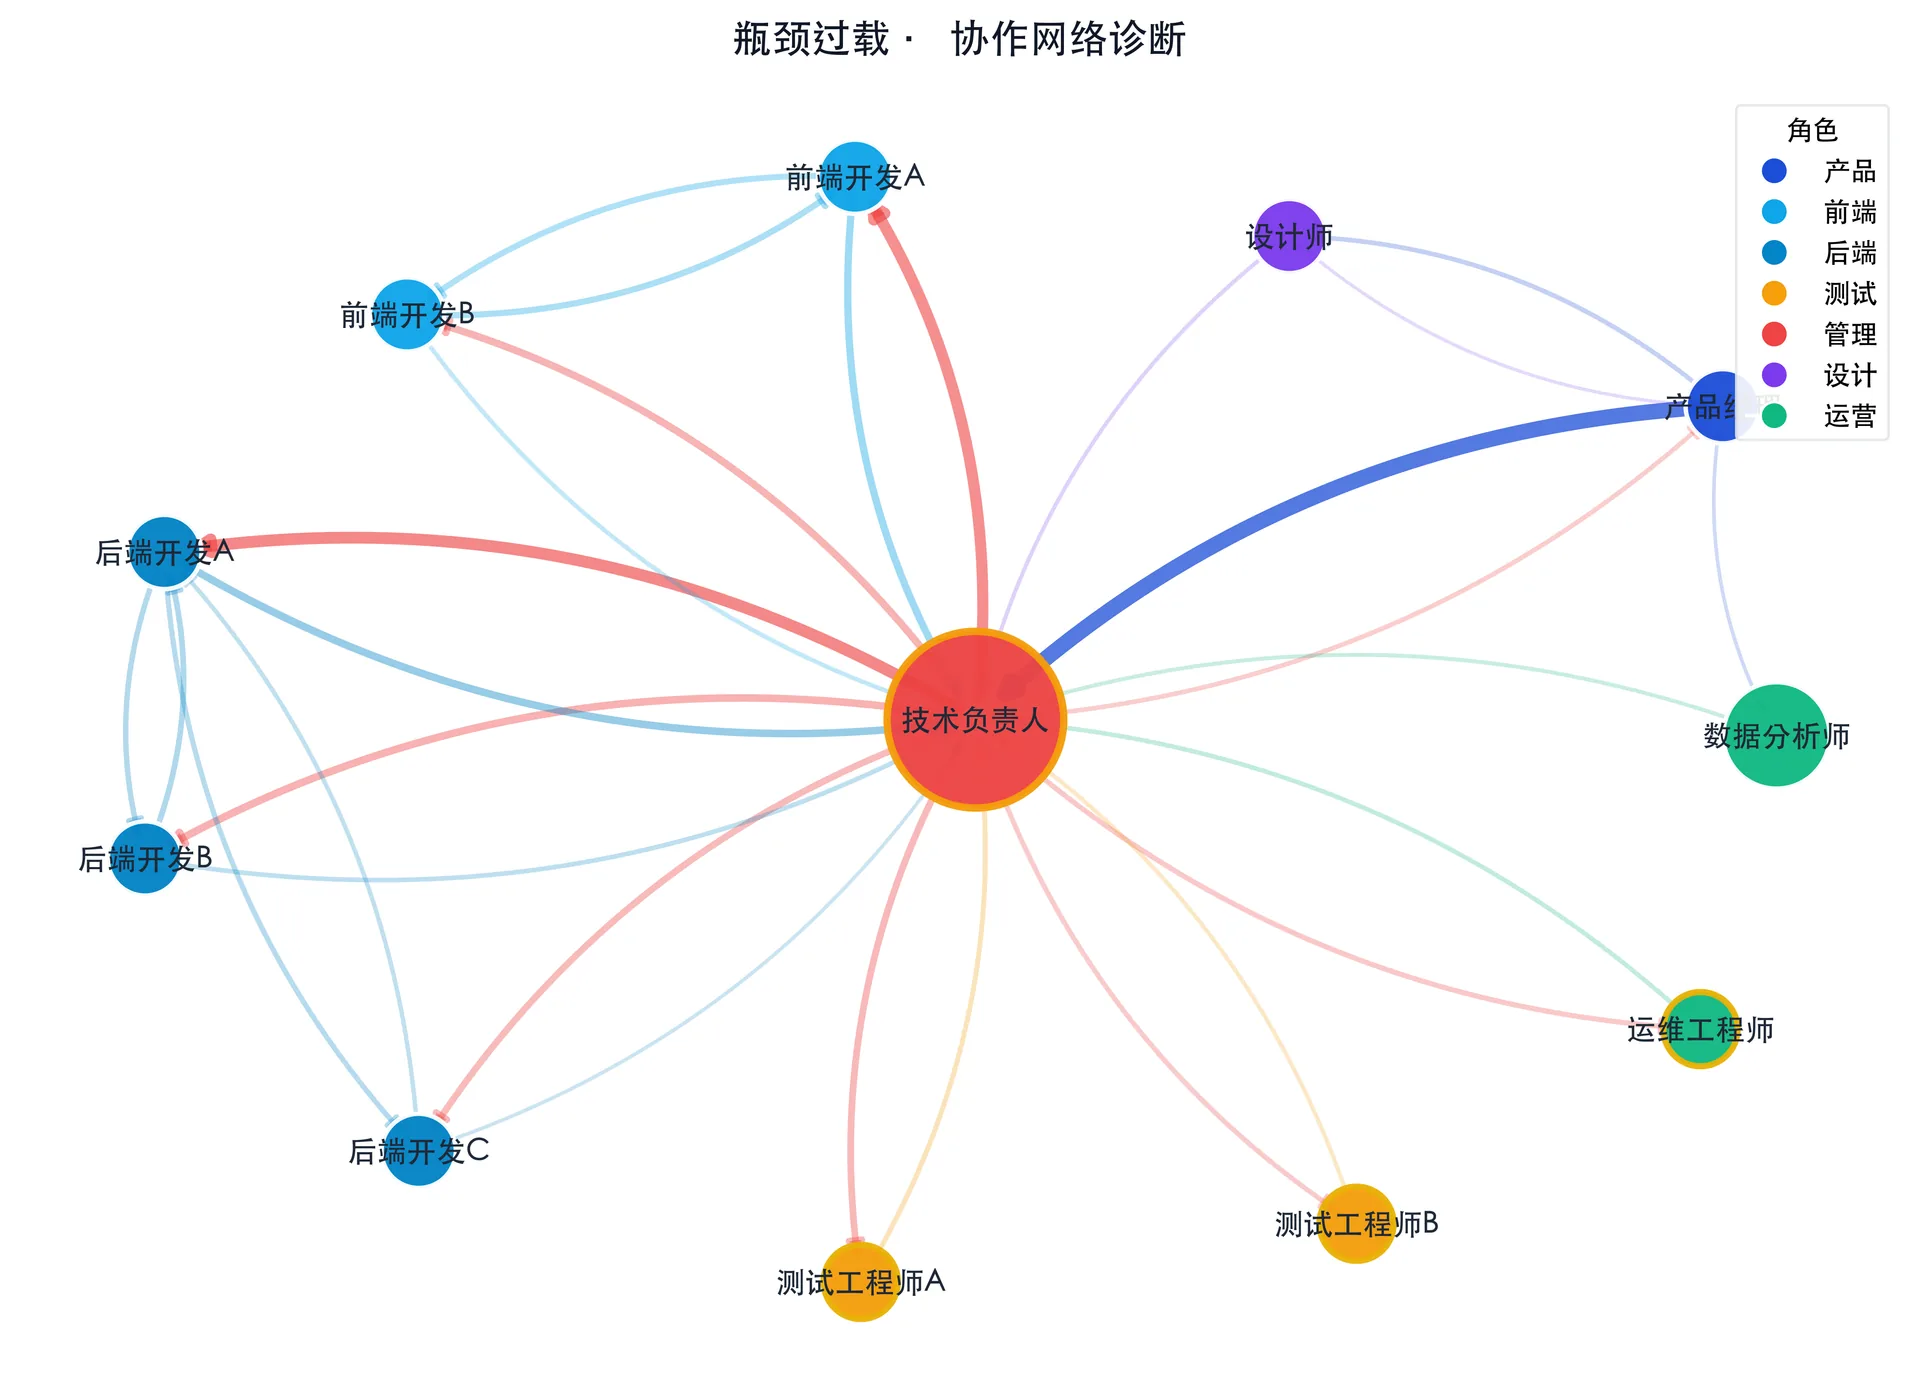
Bottleneck overload: the red node is carrying too much
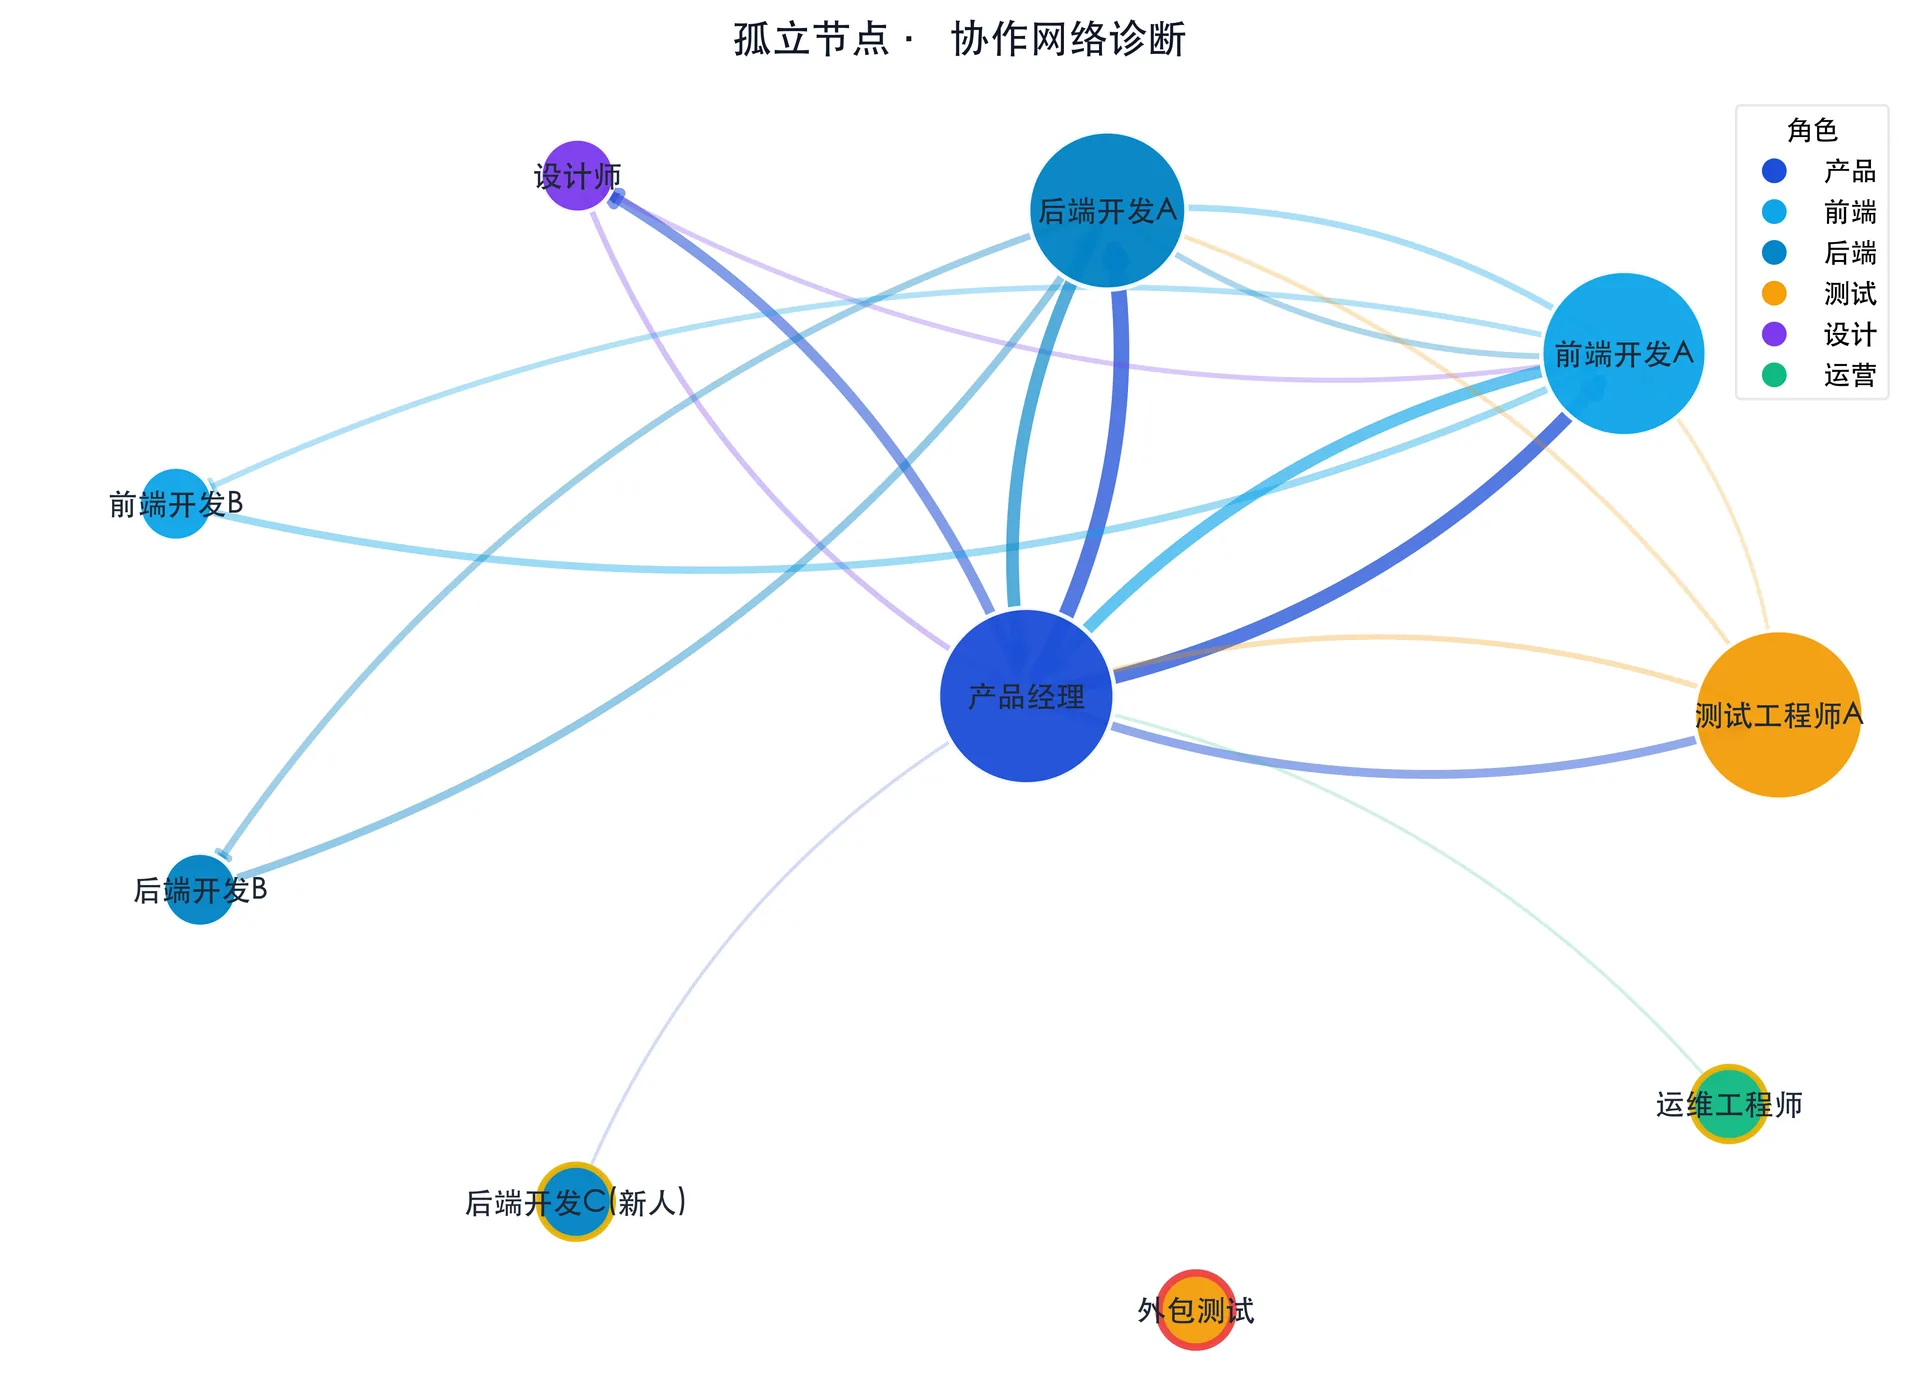
Isolated member: the outsourced tester in the red circle has no link to the team at all, and the new developer in the yellow circle has only one weak connection
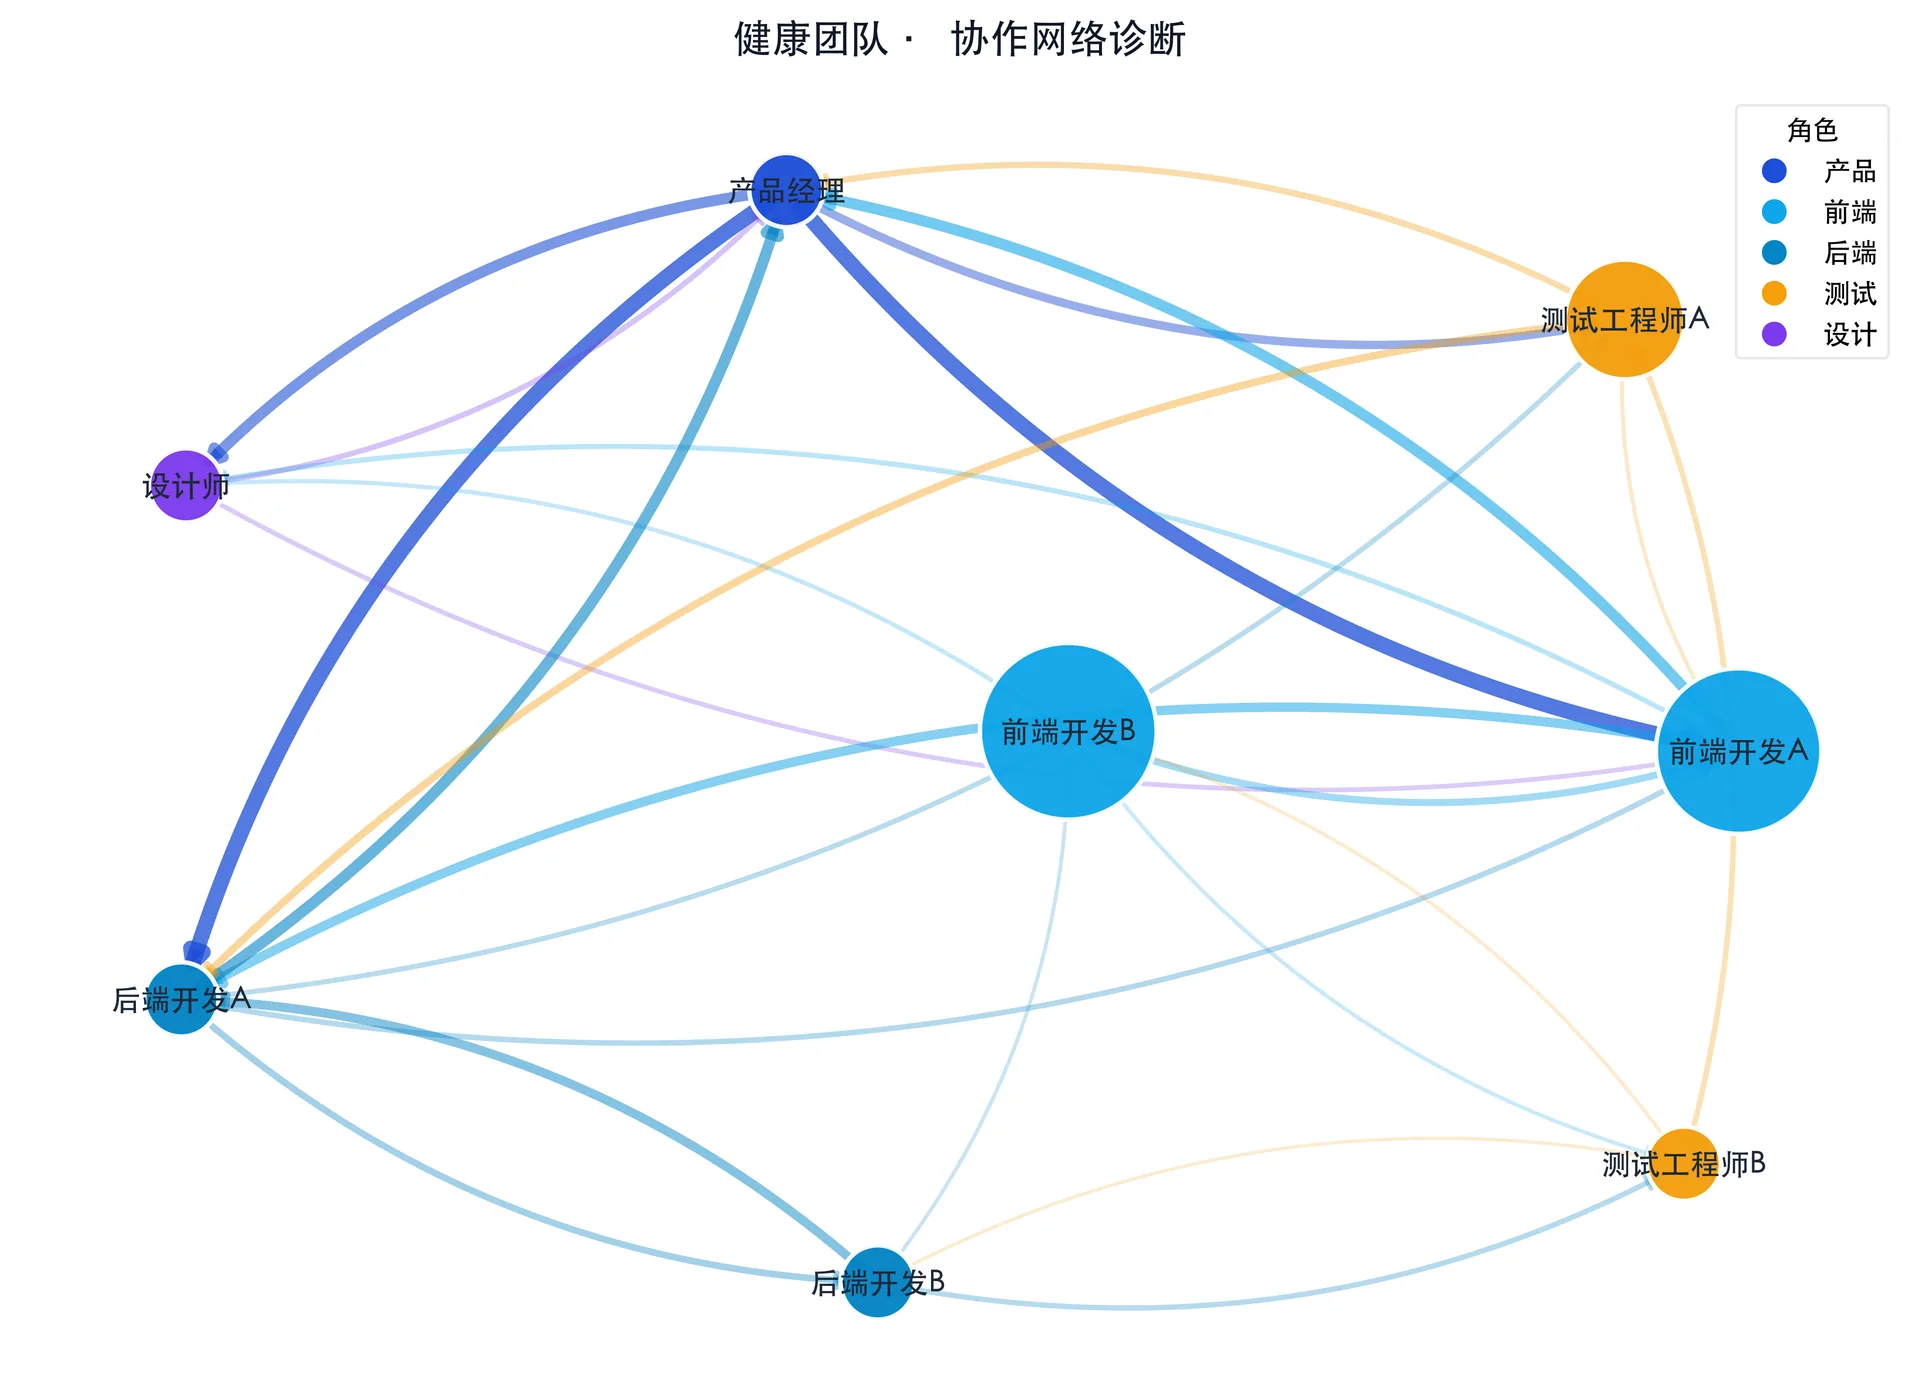
Healthy team: no overloaded node and no isolated member
Stop guessing. See your team collaboration with data.
The method comes from our thesis research, so collaboration problems show up as numbers instead of feelings.
Nova draws the network from your interaction data and shows the bottlenecks, the isolated members and the weak links.
Featured demos from the Nova interaction library
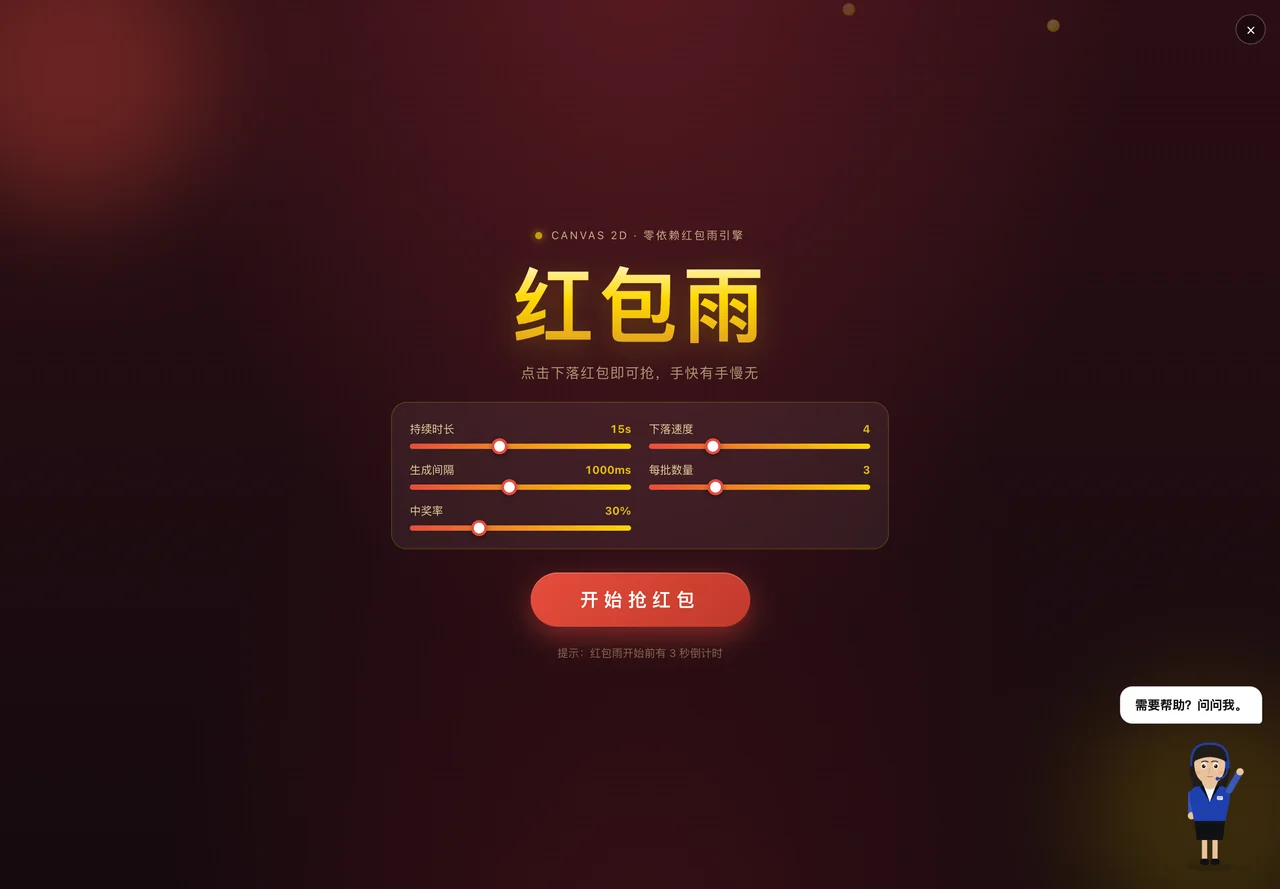
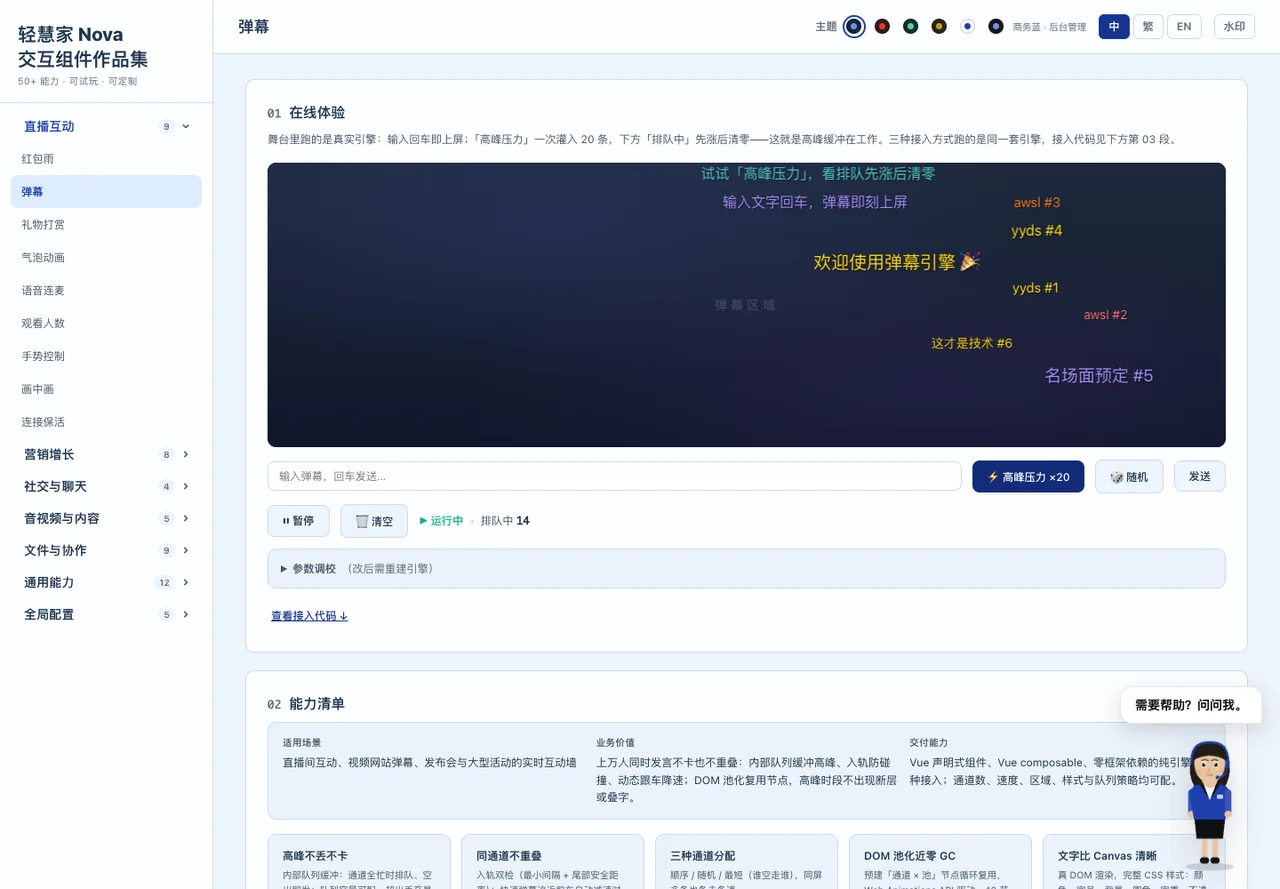
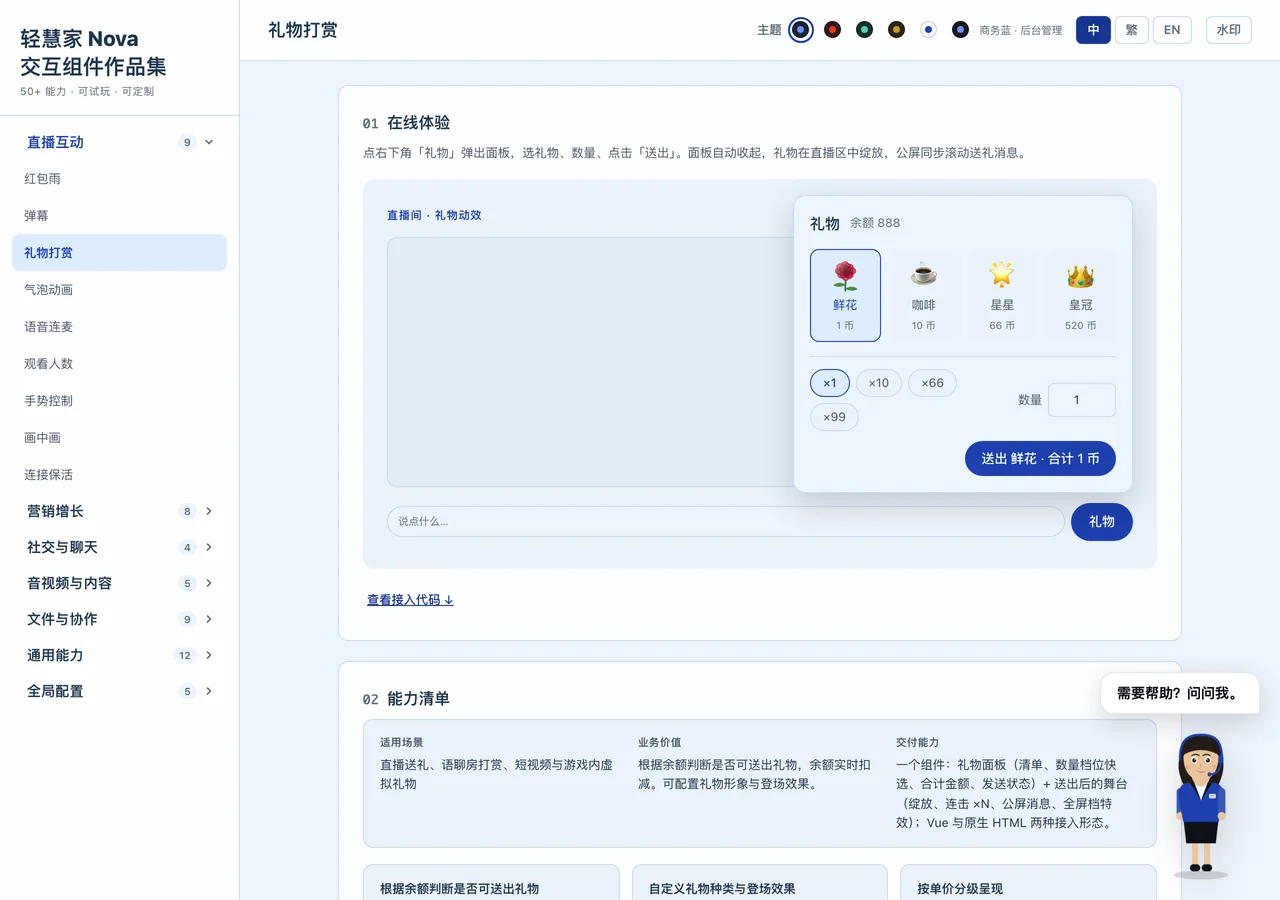
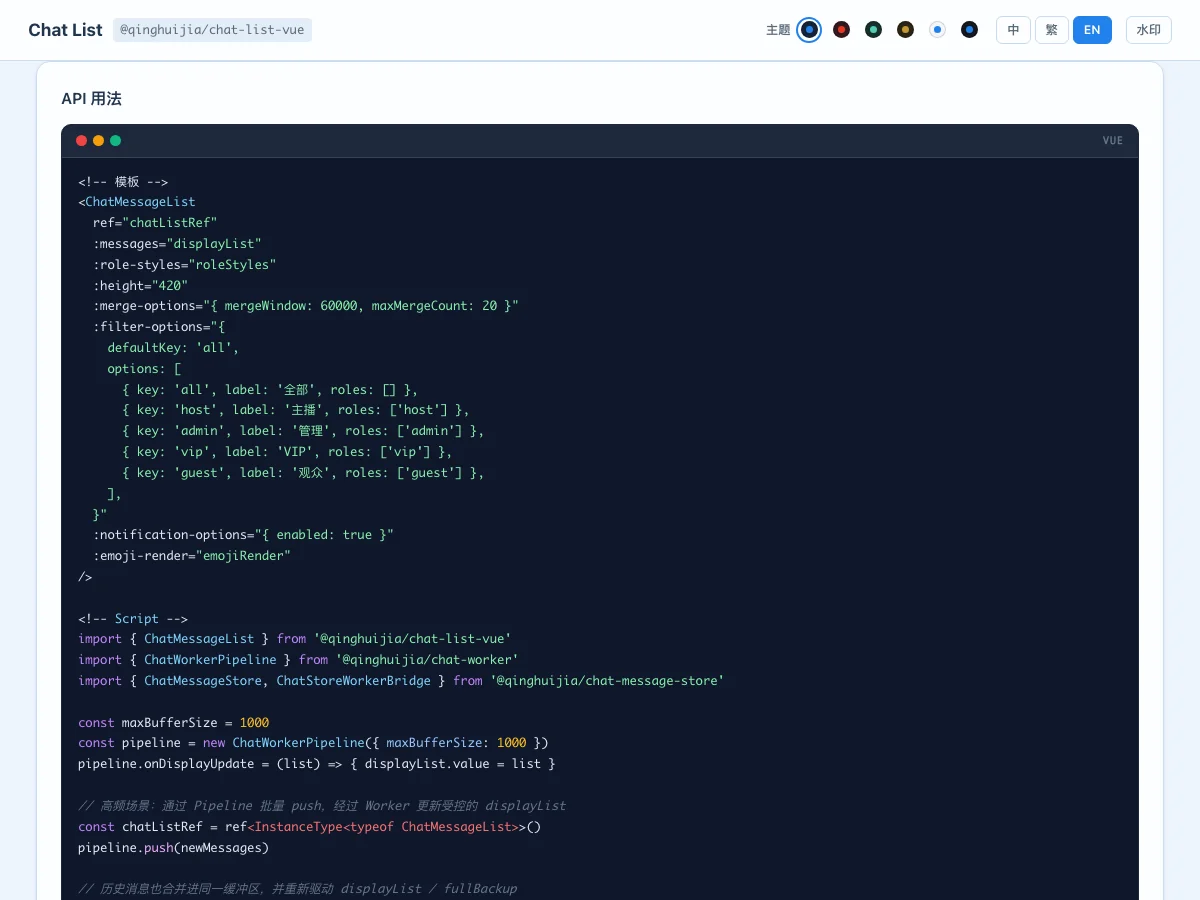
50+ production-ready modules — pick what you need, no need to build from scratch.
Built on real-world project experience, AI-assisted, fully tested with edge cases covered. Drop into an existing app or start a new build.
- Mobile
- Web
- Large screens
Pricing
Pay per use, or integrate it into your own project
Free
See what the data says
- Diagnosis quota · 5 / year
- Network graph + health score
- Network metrics (density, centralization, clustering)
- Issue list · Top 2
- Specific recommendations
- PDF report export
- Historical comparison
- Where it runs · On this site
- Data source · Manual input
5 diagnoses per year · quota shared per network · no signup
Single report
Most popularOne complete diagnosis report
- Diagnosis quota · Per report
- Network graph + health score
- Network metrics (density, centralization, clustering)
- Issue list · Full
- Specific recommendations
- PDF report export
- Historical comparison
- Where it runs · On this site
- Data source · Manual input
Full recommendations and PDF report
Integrate into your project
Make diagnosis part of your system
- Diagnosis quota · Unlimited
- Network graph + health score
- Network metrics (density, centralization, clustering)
- Issue list · Full
- Specific recommendations
- PDF report export
- Historical comparison
- Where it runs · Self-hosted
- Data source · API integration
Scope and system complexity vary, so tell us the scenario first
Feature comparison
| Feature | Free | Single report | Integrate |
|---|---|---|---|
| Diagnosis quota | 5 / year | Per report | Unlimited |
| Network + scoreNetwork graph + health score | |||
| MetricsNetwork metrics (density, centralization, clustering) | |||
| Issue list | Top 2 | Full | Full |
| Specific recommendations | — | ||
| PDF report export | — | ||
| Historical comparison | — | — | |
| Where it runs | On this site | On this site | Self-hosted |
| Data source | Manual input | Manual input | API integration |
| Report template and branding | — | — | |
| Integration delivery and handover | — | — |
50+ components · integration license
All of them come from real shipped projects and have been tested end to end. What you are buying is engineering time: one complex interaction component takes 3–5 person-days to build yourself, so 50 of them is 150–250 person-days.
Single component
¥699
Commercial license for 1 project · saves 3–5 person-days
Pack of 10
¥3,980
Pick any 10 · 1 project · about ¥398 each
All
Most popular¥6,800
Unlimited projects · MCP access · 12-month updates · about ¥136 each
All + source
¥19,800
Unlimited projects · Readable source · Modifications allowed
Integration service
Environment setup, style alignment, performance tuning, MCP wiring. Fixed-price per project also available.
About Nova
The diagnosis method comes from original academic research measured as a network measured as a network.
Nova provides diagnosis and integration licenses for the interaction components.
—— Qinghuijia
Talk to us
Email support
For non-urgent questions. We reply within one business day.
WeChat support
Scan the code to add us and mention "Nova" to get approved faster. Best for urgent issues or anything that needs detailed communication.